It can be very tempting to instrument all the things and have a lot of data, but that comes with a burden, both financial and also in terms of time spent developing. What would be the prime candidates for observing and generating metrics on?
What constitutes a metric?
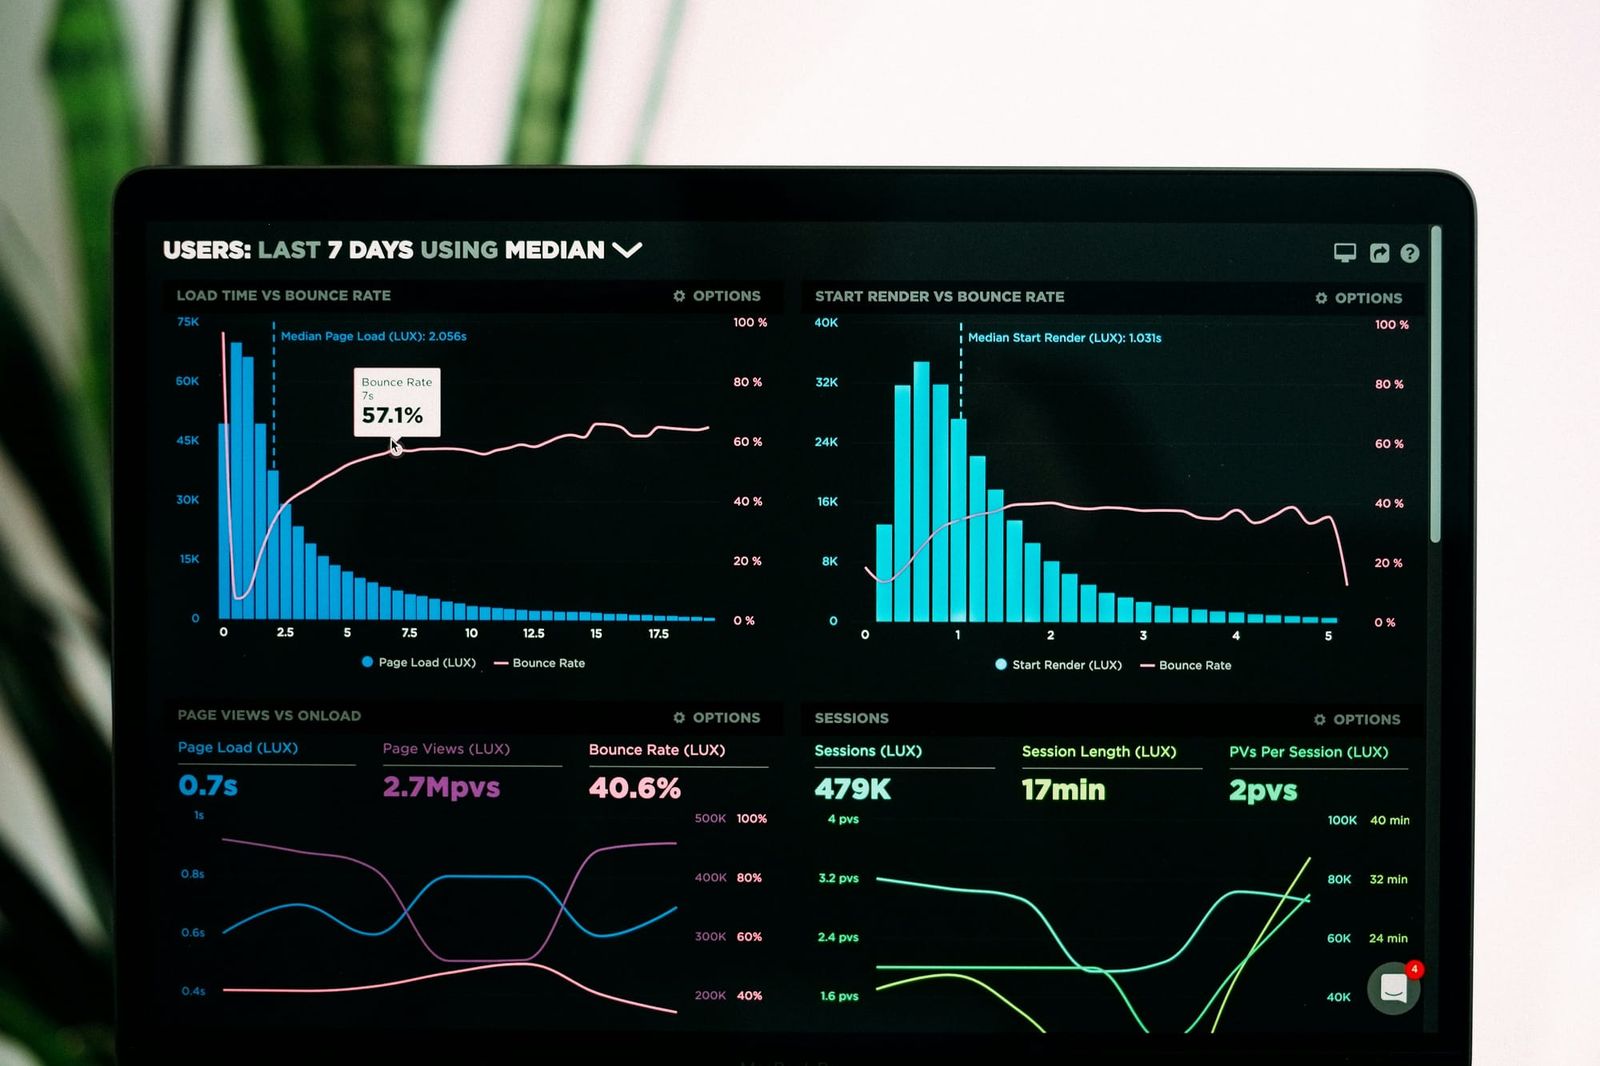
A metric is a data point emitted by an application, usually with some additional information attached to it - generally referred to as tags.
Most modern applications are instrumented using APM - application performance monitoring. The APM integration creates traces - which highlight transactions happening in your application; for example when a user requests a page. Most APM instrumentation will also integrate with 3rd party addons - such as your database layer, caching layer, etc. From the automatically generated traces, which can be further manually annotated (for example: with user IDs) one can generate very good metrics.
Why add custom metrics?
The APM instrumentation will generate broad strokes metrics - it will tell you how many times you query the DB for each page load a user does and how long those queries took. However, it will not tell you more application-specific, or in most cases business-specific metrics. An example where generating custom metrics from the code would be to measure how many times a particular condition is satisfied; an example I recently had was to add a metric for when objects older than 18 months were retrieved from our storage layer.
Covering such a case from an APM-generated metric would be possible but it would mean we would have to annotate all transactions with the age of the object fetched from the storage layer, which would be a lot of effort; and also would generate a lot of metrics for objects we might not care about - therefore ending up as a quite costly option!
This example does not mean you should create custom metrics for everything but rather consider them when you are thinking about developing your next feature.
I tend to think about metrics in 3 broad categories depending on how they will be used:
- metrics used for product decisions/development
- metrics used for monitoring and alerting
- metrics used for performance tuning
1. Metrics to aid in product decisions and/or development
These are the metrics that are most commonly left out of development plans because such metrics would not directly shape the current or future state of the code the developer is currently working on. These metrics impact product decisions, and as most developers work in cross-functional squads, I think it is key for any engineer to also adopt somewhat of a product owner mindset and think about what would constitute a good metric for furthering the product or feature that they are working on.
When developing a new feature determining adoption rates, usage rates and usage patterns is almost always a very difficult job. This is where as developers, we can pre-empt some of these questions, and think ahead of possible metrics which would help answer some of these questions as we roll out the feature/product.
On top of easily transformable metrics from the APM (eg: how many times the resource was requested, how long it took, etc); we should have product-specific information:
- how many records did it retrieve?
- what was the average age of the document?
- how many different users have accessed the feature? … and the list can continue and be tweaked depending on what the feature you are developing is.
When trying to think of metrics that would fit in this category, try to answer the question: what information is needed to inform the next decision in our product development roadmap?.
2. Metrics used for monitoring and alerting
This is a critical set of metrics which are the ones that are most commonly part of any system, as they inform the overall health of our application.
Common metrics here would be:
- CPU/memory usage
- Error rates
- A number of different requests for each path by HTTP response code etc.
However, there are more subtle metrics which one can use for monitoring, and thus alerting, that can and should be product-specific3 am. For example, you might know that for your particular product, you expect on average 3 items in the basket. If for some reason that average starts drifting away from that number, it may be cause for concern.
When creating metrics that you wish to use for alerting keep in mind that for alerts to be effective they need to be actionable. Imagine having to wake up at 3 am and resolve an issue indicated by the metric - if there are no clear instructions, it will be a very tedious and error-prone process, as you are essentially relying on the 3 am ongoing judgement to make decisions; so metrics that are used to generate alerts should have very clear levers that can be pulled to resolve issues that arise from unexpected levels.
If you take the previous example - a metric for the average basket, the average basket size decrease or increase could be driven by a lot of factors (eg: ongoing promotions for a certain item - so overall smaller baskets, free shipping if over a certain spend amount so more items, etc); which in turn makes for a bad metric to alert on as it’s not something that can be easily fixed. However, it is a great metric to monitor as an indicator of the health of the system.
Metrics used for monitoring do not need to also be used for alerting, so one can mix and match. When approaching alerting - think actionable, when approaching monitoring take into consideration product-specific top-line metrics.
3. Metrics used for performance tuning
Arguably, there is an overlap between the metrics used for monitoring and the metrics for performance tuning. I wanted to highlight that sometimes we want to add additional instrumentation to particular areas that we think might be having a disproportionate impact on the overall performance of our application.
There are a number of metrics that are usually provided by the language-specific engine, for golang that would be things like:
- number of goroutines
- how many times has the garbage collector (GC) ran
- how long did the GC take
- what is the size of the heap … etc
These metrics can help a developer inform of issues like memory leaks, lack of usage of pointers for shifting large amounts of data, concurrency issues due to too many goroutines/threads running, etc. These are all valuable metrics to have and inspect on a semi-regular basis and definitely keep a close look on when doing anything like bumping underlying language versions.
Conclusion
To recap, think of metrics in 3 broad categories:
- used for furthering product development
- used for monitoring and alerting
- used for performance tuning the application
Setting some time aside to consider what metrics would be suitable to capture those 3 categories is key, as it ensures we have the right data to make correct decisions about both engineering tweaks/fixes and future features. I would suggest trying to identify at least 1 metric per category for any new piece of work you develop.
Something to consider is that there will always be a case of it would have been helpful to start collecting this data 3 months ago; so my recommendation is to timebox the effort that goes into selecting the metrics you want since there is a tangible likelihood that once you understand the usage patterns you will be required to tweak your metrics. It is also important to have a semi-regular review of your metrics, as you might find that particular thing considered key metrics 6 months ago, is no longer of interest, and thus gives us a chance to clean up metric collection and also our dashboards.
Author: Alexandru Stoica